By Airon Rodrigues
Telling a story, especially in today’s age of marketing, is a great way to engage an audience. How are stories generally told? One can argue stories are told through the form of text, allowing the reader to familiarise themselves with the topic they are reading. But as great as lengthy content is, especially for SEO, no one likes reading boring text continuously with no breaks or images.
As marketers, how do we combat this?
Through the form of infographics.
Yes, information displayed through graphics.
This blog post will discuss what an infographic is, why you should be using them, and how to optimise them for SEO.
Info… What?
An infographic is a visual display of information. It conveys statistics, facts, and any other information through the form of visual images such as emoji’s, illustration and visual icons.
The purpose of Infographics is to communicate information visually.
Unlike plain text, infographics combine elements of text image, charts, diagrams and, more recently, video, an infographic is an effective tool to present data and explain complex issues in a way that can quickly lead to insight and better understanding.
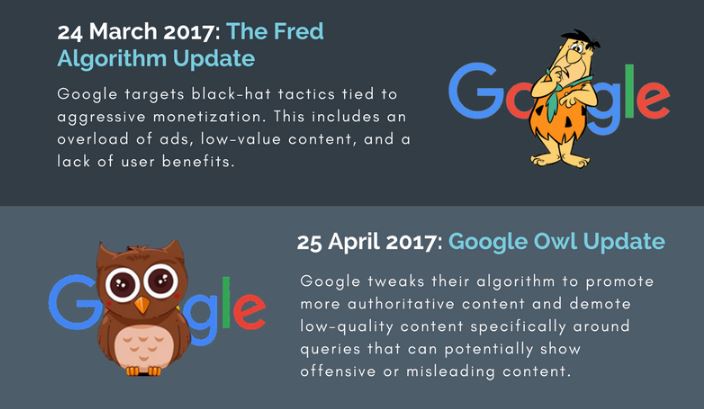
Above: Our recent infographic on the 6 biggest SEO updates of 2017. See the full infographic here
Ok great, I understand what an infographic is, but why should I use it and how is it going to help me?
A New York-based visual communications company Infographic World surveyed 100 businesses and 1,100 consumers to find out just how effective infographics are.
Given how dramatically the digital and social landscape has changed in recent years, we wanted to conduct a study on the state of infographics. What we found is that visual storytelling helps businesses, marketers and communications professionals reach their target audience in more meaningful ways than virtually any other type of medium.
Justin Beegel – Infographic World CEO
The conducted surveys have been transferred and created as a report, which can be found here
Here are a few of the highlights from the report:
- 74% of marketers rely on visuals in their social media messaging
- 56% of companies queried use infographics.
- 84% who’ve used them consider the medium effective
For those looking for a quick answer as to why infographics work, it’s because of this; 90% of information transmitted to the brain is visual according to the report, and visuals are known to improve learning and retention by 400%.
On a scale of most to least, the following mediums affect learning and retention of information most, according to the report:
- Infographics 61%
- Commercials 55%
- PowerPoints 48%
- Articles with images 46%
- Articles with text only 38%
- Blog posts 36%
Optimising An Infographic For SEO
Now that we know that infographics are our friends, let’s start to think about how we can introduce them to the world of SEO, and get the most out of our marketing campaigns.
As with anything in SEO, start with keyword research.
You won’t we able to take advantage of keywords within an infographic, but there are still arears where you can capitalise. Therefore, it’s important to start conducting keyword research to identify the primary keyword, as well as secondary words to include.
Give the Infographic a Name!
By name, we mean File Name. Once you have identified which keywords you would like to target, you must ensure the file name clearly describes the infographic.
The file name is one of the key ways in describing your infographic to Google, a file name such as image001.jpg does say much, the most we know is that it’s a jpg image. This doesn’t give Google enough information as to what the “image” is about.
So, what do we do? Be descriptive. If you are putting together an infographic on house cleaning tips, the file name could be house-cleaning-tips-infographic.jpg
Title Tags
Right from the beginning, the keywords need to be visible. It’s important to place keywords in the title because this is the first thing users see when surfing the web. Therefore, Google places a high importance on keywords within a page title, and if the keyword phrase is there, it will positively affect SEO.
Meta Description
Like title tags, meta descriptions are visible within the search results and help users better understand a listing before clicking through to the website.
Here’s an example of a title and deception for an infographic on House Cleaning Tips:
ALT Text
Just like the file name, the ALT Text holds a high importance.
An ALT Text is the text alternative of an image that lets someone know what an image contains in the event that it doesn’t load properly.
Also, this gives you another change to tell Google what the image is about. When naming the ALT text, you want to be clear and descriptive. Following our previous example of house cleaning tips, an ALT text here could be “An infographic on house cleaning tips”.
URL
Always ensure the primary keyword, if possible, and the word “infographic” is in the URL. Like the file name and ALT text, the URL communicates what the page is about which is why inserting your keywords here is key. Whenever you have a chance to describe your content to Google, use it.
Heading 1 Tag or H1 Tag
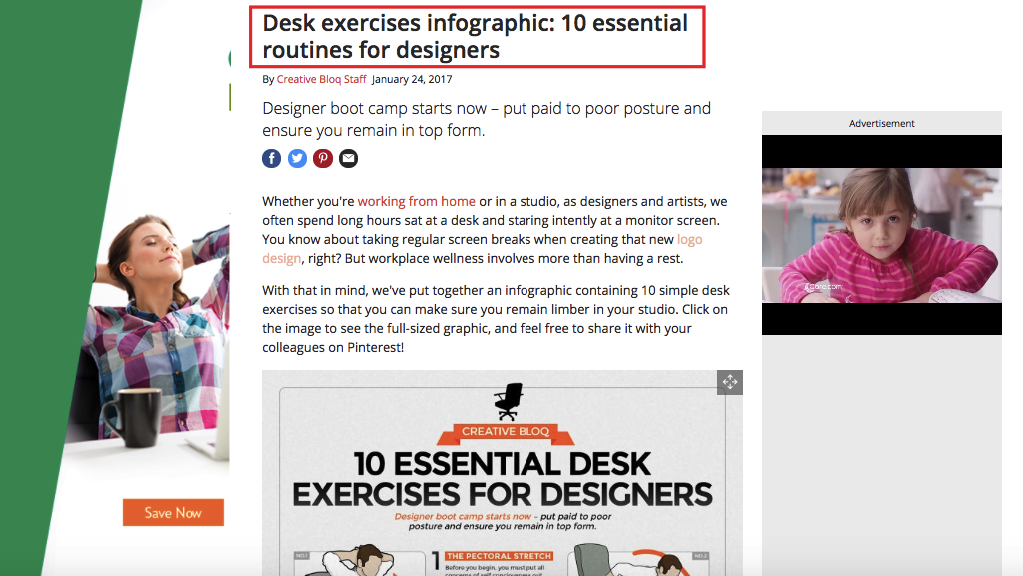
The actual heading within the infographic is set in the image, which leaves us with no control. However, you can still place a heading above the infographic. This heading should be the h1 for the page, and it should include your primary keyword. For example, the below page uses the same heading within the infographic as the H1 of the page.
This is a simple, yet effective, way to boost your infographic for SEO. Once, again, it’s describing the content to the search engines.
Supporting Text
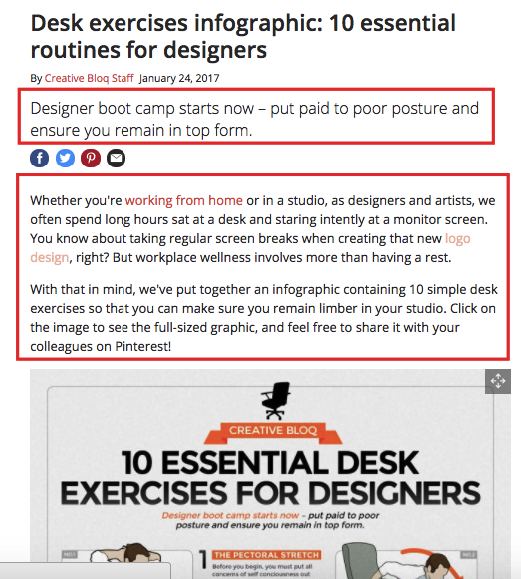
It’s always wise to include supporting text. This gives the search engines information to chew on, seeing as the cannot read text within an image, you will have to provide additional information to describe the image on the page. Here, we can include secondary keywords, as well as helpful information to users reading the infographic.
As you can see, the supporting text is nothing extreme. It’s just extra information with some links adding value to the page.
The benefit of this is that helps your infographic get noticed and it increases the likelihood that it’s indexed under the right keywords.
Incorporating an infographic as part of your content marketing strategy is not only a great way to re-engage readers and research their intake of information, but to also boost SEO by applying the tips mentioned above.

